![]() > Benchmarking
> Benchmarking

Common Questions
hide me
How can an ASC participate with the data benchmarking?
If your center is not part of the ASC QC membership, you can access the information for your benchmarking purposes quarterly through the ASC QC website.
How often does the ASC QC update the benchmarking data on their website?
The benchmarking data is updated quarterly. The results are available on the website by the end of the following quarter.
How many ASCs are represented in the quality benchmarking program?
What are the benefits of participating or using the benchmarking data?
The ability to:
- Measure, track, and benchmark clinical outcome metrics with other ASCs to improve quality and enhance patient safety
- Utilize outcome data to market your ASC and promote your reputation
- Access Best Practice Toolkits to improve processes
- Satisfy CMS and Accreditation Organization requirements for participation in external benchmarking of clinical outcomes
Fourth Quarter 2023
During 2020, the ASC Quality Collaboration developed a new data platform for the collection and reporting of ambulatory surgical center (ASC) quality data. That new platform was used throughout 2021 to compile benchmarking data. Starting with First Quarter 2022, the most recent four quarters of data are included in this report, along with the annual (Q1 through Q4) rate for each measure.
It should be noted that two measures have been retired from this report since the 2019 quality data was posted. These two measures are Prophylactic IV Antibiotic Timing and Appropriate Surgical Site Hair Removal. As a result, data for these two measures is no longer included in the quality report. However, the specifications for those two measures are still included in the Implementation Guide.
This public report has been made possible through the voluntary efforts of participants in the ASC Quality Collaboration. The Fourth Quarter 2023 data was collected from 2,102 ASCs. The following organizations agreed to collect and submit clinical quality data reflecting patient admissions* from October 01 through December 31:
- Ambulatory Surgery Center Association;
- AMSURG;
- California Ambulatory Surgery Association;
- Covenant Physician Partners;
- NVision Eye Centers;
- NueHealth;
- Proliance Surgeons;
- Regent Surgical Health;
- SCA Health;
- Sovereign Healthcare;
- Specialist Management Solutions;
- Surgery Partners;
- Surgery Ventures powered by HCA Healthcare;
- Surgical Management Professionals;
- Tenet/United Surgical Partners International (USPI)
This report presents aggregated performance data for the following ASC facility-level quality measures developed by the ASC Quality Collaboration:
- Patient Fall in the ASC
- Patient Burn
- All Cause Hospital Transfer/Admission
- Wrong Site, Side, Patient, Procedure, Implant
- Normothermia
- Unplanned Anterior Vitrectomy
- Toxic Anterior Segment Syndrome (TASS)
- All Cause Emergency Department Visit Within One Day of Discharge
- All Cause Unplanned Hospital Admission Within One Day of Discharge
This data and the accompanying information do not present all there is to know about the quality of ASCs. Patients are encouraged to discuss these quality indicators with their local ASC staff and their physician.
The data presented here has been self-reported by participating organizations and has not been independently validated by the ASC Quality Collaboration.
Questions or comments regarding this report may be directed to Kathy Wilson, Executive Director, ASC Quality Collaboration at kathy.wilson@ascquality.org.
Patient Fall in the ASC
Falls are an important issue for patients having outpatient procedures or surgery because virtually all patients receive sedatives, anesthetics and/or pain medications as a routine part of their care. The use of these medications increases the likelihood of a fall.
The frequency of ASC admissions experiencing a fall while in the confines of participating ASCs is shown below as a rate per 1000 admissions. Lower rates are better.
2023Q4 Rate of Patient Falls |
0.141 per 1000 admissions |
Represents 2,671,723 ASC admissions seen at 2,101 ASCs between 2023-10-01 and 2023-12-31
The data trends for this measure over the last four quarters as well as an annual rate for 2023 are presented below in both tabular and graphic formats.
Data Summary: Patient Fall in the ASC
|
2023Q1 |
2023Q2 |
2023Q3 |
2023Q4 |
Annual 2023 |
|
|
Patient Fall Rate per 1000 ASC Admissions |
0.157 |
0.128 |
0.126 |
0.141 |
0.138 |
|
Number of ASC Admissions Represented |
2,499,040 |
2,670,575 |
2,586,281 |
2,671,723 |
10,427,619 |

Patient Burn
Burns are an important issue for patients having outpatient procedures or surgery because the equipment and supplies routinely used in providing these types of services can increase the risk that a patient will experience an unintended burn.
The frequency of ASC admissions experiencing a burn, regardless of severity, while in the care of participating ASCs is shown below as a rate per 1000 admissions. Lower rates are better.
2023Q4 Rate of Patient Burns |
0.015 per 1000 admissions |
Represents 2,671,640 patient admissions seen at 2,101 ASCs between 2023-10-01 and 2023-12-31
The data trends for this measure over the last four quarters as well as an annual rate for 2023 are presented below in both tabular and graphic formats.
Data Summary: Patient Burn
|
2023Q1 |
2023Q2 |
2023Q3 |
2023Q4 |
Annual 2023 |
|
|
Patient Burn Rate per 1000 ASC Admissions |
0.017 |
0.015 |
0.017 |
0.015 |
0.016 |
|
Number of ASC Admissions Represented |
2,495,914 |
2,671,377 |
2,586,104 |
2,671,640 |
10,425,035 |

All Cause Hospital Transfer/Admission
ASCs provide surgical services to patients not requiring hospitalization. Therefore, ASCs screen patients referred to their facilities to ensure they can be safely cared for as an outpatient.
The frequency of ASC admissions experiencing a transfer or admission to a hospital upon discharge from participating ASCs is shown below as a rate per 1000 admissions. Not all conditions requiring a hospital transfer or admission result from the care the patient received in the ASC, nor can all medical conditions requiring a hospital transfer or admission be anticipated in advance. Therefore, some level of hospital transfer or admission is expected.
2023Q4 Rate of Hospital Transfers/Admissions |
0.818 per 1000 admissions |
Represents 2,672,030 patient admissions seen at 2,102 ASCs between 2023-10-01 and 2023-12-31
The data trends for this measure over the last four quarters as well as an annual rate for 2023 are presented below in both tabular and graphic formats.
Data Summary: All Cause Hospital Transfer/Admission
|
2023Q1 |
2023Q2 |
2023Q3 |
2023Q4 |
Annual 2023 |
|
|
Hospital Transfer/Admission Rate per 1000 ASC Admissions |
0.812 |
0.796 |
0.807 |
0.818 |
0.808 |
|
Number of ASC Admissions Represented |
2,495,510 |
2,669,039 |
2,588,854 |
2,672,030 |
10,425,433 |

Wrong Site, Side, Patient, Procedure, Implant
Wrong site, wrong side, wrong patient, wrong procedure and wrong implant events are a concern for patients having outpatient procedures or surgery. There are steps that can be taken to help prevent errors such as surgery performed on the wrong part of the body or the wrong side of the body.
The frequency of ASC admissions experiencing a wrong site, wrong side, wrong patient, wrong procedure or wrong implant event while in the care of participating ASCs is shown below as a rate per 1000 admissions. Lower rates are better.
2023Q4 Rate of Wrong Site, Side, Patient, Procedure, Implant Events |
0.031 per 1000 admissions |
Represents 2,672,035 patient admissions seen at 2,102 ASCs between 2023-10-01 and 2023-12-31
The data trends for this measure over the last four quarters as well as an annual rate for 2023 are presented below in both tabular and graphic formats.
Data Summary: Wrong Site, Side, Patient, Procedure, Implant
|
2023Q1 |
2023Q2 |
2023Q3 |
2023Q4 |
Annual 2023 |
|
|
Rate of Wrong Site, Side, Patient, Procedure, Implant Events per 1000 ASC Admissions |
0.031 |
0.030 |
0.024 |
0.031 |
0.029 |
|
Number of ASC Admissions Represented |
2,495,033 |
2,670,575 |
2,586,281 |
2,672,035 |
10,423,924 |

Normothermia
Maintaining body temperature within a normal range (normothermia) is important in patients who have general, spinal or epidural anesthesia lasting 60 minutes or more. Normothermia helps reduce the risk of surgical complications, including the risk of developing an infection at the surgical site.
The percent of eligible ASC patients that are normothermic within 15 minutes of arrival into the Post Anesthesia Care Unit (PACU) is displayed below. Higher percentages are better.
2023Q4 Percent of Eligible ASC Patients with Normothermia |
98.9% |
Represents 310,731 patient admissions seen at 1,631 ASCs between 2023-10-01 and 2023-12-31
The data trends for this measure over the last four quarters as well as an annual rate for 2023 are presented below in both tabular and graphic formats.
Data Summary: Percent of Eligible ASC Patients with Normothermia
|
2023Q1 |
2023Q2 |
2023Q3 |
2023Q4 |
Annual 2023 |
|
|
Percent of Eligible ASC Patients with Normothermia |
98.8% |
98.9% |
99.1% |
98.9% |
0.989 |
|
Number of ASC Admissions Represented |
262,487 |
281,861 |
258,522 |
310,731 |
1,113,601 |

Unplanned Anterior Vitrectomy
An unplanned anterior vitrectomy is a potential complication of cataract surgery.
The percent of ASC cataract surgery patients that experienced an unplanned anterior vitrectomy in ASC cataract surgery patients is shown below. Lower rates are better.
2023Q4 Percent of ASC Cataract Surgery Patients with Unplanned Anterior Vitrectomy |
0.170% |
Represents 464,763 patient admissions seen at 821 ASCs between 2023-10-01 and 2023-12-31
The data trends for this measure over the last four quarters as well as an annual rate for 2023 are presented below in both tabular and graphic formats.
Data Summary: Unplanned Anterior Vitrectomy
|
2023Q1 |
2023Q2 |
2023Q3 |
2023Q4 |
Annual 2023 |
|
|
Percent of ASC Cataract Patients with Unplanned Anterior Vitrectomy |
0.301% |
0.200% |
0.156% |
0.170% |
0.194% |
|
Number of ASC Admissions Represented |
250,028 |
403,502 |
461,532 |
464,763 |
1,579,825 |

Toxic Anterior Segment Syndrome (TASS)
Toxic anterior segment syndrome (TASS) is a potential complication of anterior segment eye surgery.
The frequency of TASS is shown below as a rate per 1000 anterior segment surgery patients. Lower rates are better.
2023Q4 Rate of Toxic Anterior Segment Syndrome (TASS) |
0.008 per 1000 Anterior Segment Surgery Patients |
Represents 238,391 patient admissions seen at 746 ASCs between 2023-10-01 and 2023-12-31
The data trends for this measure over the last four quarters as well as an annual rate for 2023 are presented below in both tabular and graphic formats.
Data Summary: Toxic Anterior Segment Syndrome (TASS)
|
2023Q1 |
2023Q2 |
2023Q3 |
2023Q4 |
Annual 2023 |
|
|
Rate of TASS per 1000 Anterior Segment Surgery Patients |
0.032 |
0.017 |
0.034 |
0.008 |
0.023 |
|
Number of Anterior Segment Surgery Patients Represented |
222,152 |
238,723 |
295,414 |
238,391 |
994,680 |

All Cause Emergency Department Visit Within One Day of Discharge
Patients undergoing ambulatory surgery are expected to recover at home following discharge. An emergency department visit within one day of discharge is an unexpected event.
The frequency of ASC admissions experiencing an emergency department visit within one day of discharge is shown below as a rate per 1000 admissions. Not all conditions requiring an emergency department visit result from the care the patient received in the ASC, nor can all medical conditions requiring an emergency department visit following discharge be anticipated in advance. Therefore, some level of emergency department visits following discharge is to be expected.
2023Q4 Rate of All Cause Emergency Department Visits Within One Day of Discharge |
0.639 per 1000 admissions |
Represents 2,190,391 patient admissions seen at 1,742 ASCs between 2023-10-01 and 2023-12-31
The data trends for this measure over the last four quarters as well as an annual rate for 2023 are presented below in both tabular and graphic formats.
Data Summary: All Cause Emergency Department Visit Within One Day of Discharge
|
2023Q1 |
2023Q2 |
2023Q3 |
2023Q4 |
Annual 2023 |
|
|
Rate of All Cause Emergency Department Visits Within One Day of Discharge |
0.691 |
0.636 |
0.643 |
0.639 |
0.652 |
|
Number of ASC Admissions Represented |
1,996,355 |
2,122,677 |
2,077,326 |
2,190,391 |
8,386,749 |

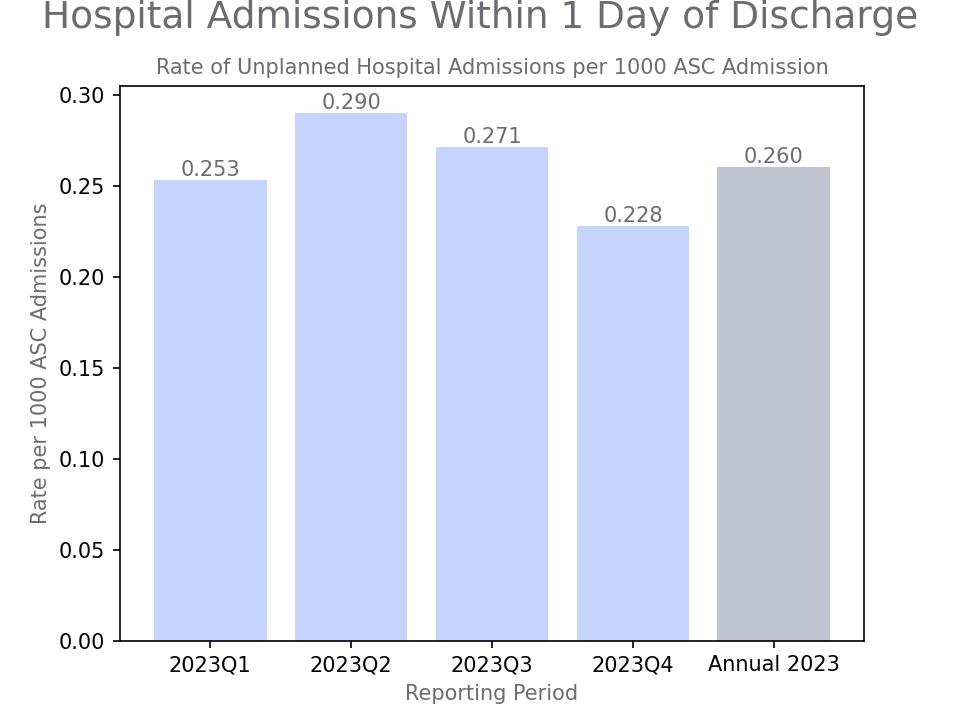
All Cause Unplanned Hospital Admission Within One Day of Discharge
Patients undergoing ambulatory surgery are expected to recover at home following discharge. An unplanned hospital admission within one day of discharge is an unexpected event.
The frequency of ASC admissions experiencing an unplanned hospital admission within one day of discharge is shown below as a rate per 1000 admissions. Not all conditions requiring a hospital admission result from the care the patient received in the ASC, nor can all medical conditions requiring an unplanned hospital admission be anticipated in advance. Therefore, some level of unplanned hospital admissions is to be expected.
2023Q4 All Cause Unplanned Hospital Admissions Within One Day of Discharge |
0.228 per 1000 admissions |
Represents 2,201,663 patient admissions seen at 1,756 ASCs between 2023-10-01 and 2023-12-31
The data trends for this measure over the last four quarters as well as an annual rate for 2023 are presented below in both tabular and graphic formats.
Data Summary: All Cause Unplanned Hospital Admission Within One Day of Discharge
|
2023Q1 |
2023Q2 |
2023Q3 |
2023Q4 |
Annual 2023 |
|
|
Rate of All Cause Unplanned Hospital Admissions Within One Day of Discharge |
0.253 |
0.290 |
0.271 |
0.228 |
0.260 |
|
Number of ASC Admissions Represented |
2,008,050 |
2,133,938 |
2,084,377 |
2,201,663 |
8,428,028 |
For more detailed information on these measures, please review the Implementation Guide found on the home page of the ASC Quality Collaboration website at www.ascquality.org.
*For purposes of this quality report, ''admission'' is defined as completion of registration upon entry into the ASC. This term is used in order to be consistent with the measure specifications.
Contact us today to learn more about how we can support you.
ASC Quality Collaboration
The only organization exclusively dedicated to advancing patient safety and quality of care delivery in ambulatory surgery centers.